
Page 26 - MDJ 2022 Jan-Jun, Volume 45 Number 1
P. 26
Ganapathy / Ibrahim
Study Patient Statistical Analysis
The calculated sample size was 384, based on the Statistical Package for Social Science (SPSS)
calculation of Klang district’s population of 879867 with version 22 (IBM, New York) was used for all statistical
a confidence interval of 95 % and a 5 % margin of error. analyses. Descriptive data was expressed as mean ±
Inclusion criteria were: (1) all patients who underwent standard deviation (SD) unless otherwise stated. Kruskal-
complete RCT with RDITN scoring in the Restorative Unit, Wallis, Spearman’s rank log coefficient, Mann-Whitney,
Pandamaran Dental Clinic from 2017-2019, and (2) Chi-Square test, and Fisher’s exact test were used due to
patients with RDITN score in their referral letter. non-normally distributed data depending on the type of
Exclusion criteria were (1) patients who defaulted follow variables and appropriateness. Simple logistic and linear
up post endodontic restoration and (2) patients who had regression were applied to measure the associations and
not given any consent. Withdrawal criteria were also predictions of certain independent variables with the
included as participants could choose to withdraw at any dependent variable. A value of p < 0.05 is considered
time. Participants were removed if the investigator deemed statistically significant. The data collected was analysed
that it was detrimental or risky for the participant to using an intention-to-treat basis.
continue.
RESULTS
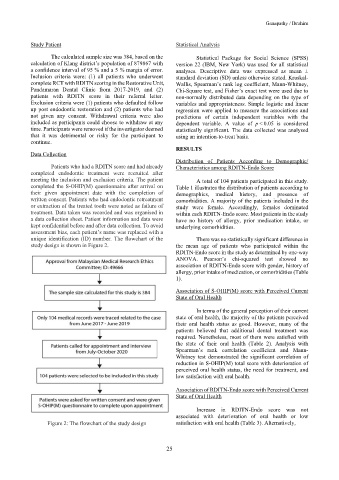
Data Collection
Distribution of Patients According to Demographic/
Patients who had a RDITN score and had already Characteristics among RDITN-Endo Score
completed endodontic treatment were recruited after
meeting the inclusion and exclusion criteria. The patient A total of 104 patients participated in this study.
completed the S-OHIP(M) questionnaire after arrival on Table 1 illustrates the distribution of patients according to
their given appointment date with the completion of demographics, medical history, and presence of
written consent. Patients who had endodontic retreatment comorbidities. A majority of the patients included in the
or extraction of the treated tooth were noted as failure of study were female. Accordingly, females dominated
treatment. Data taken was recorded and was organised in within each RDITN-Endo score. Most patients in the study
a data collection sheet. Patient information and data were have no history of allergy, prior medication intake, or
kept confidential before and after data collection. To avoid underlying comorbidities.
assessment bias, each patient’s name was replaced with a
unique identification (ID) number. The flowchart of the There was no statistically significant difference in
study design is shown in Figure 2. the mean age of patients who participated within the
RDITN-Endo score in the study as determined by one-way
ANOVA. Pearson’s chi-squared test showed no
association of RDITN-Endo score with gender, history of
allergy, prior intake of medication, or comorbidities (Table
1).
Association of S-OHIP(M) score with Perceived Current
State of Oral Health
In terms of the general perception of their current
state of oral health, the majority of the patients perceived
their oral health status as good. However, many of the
patients believed that additional dental treatment was
required. Nonetheless, most of them were satisfied with
the state of their oral health (Table 2). Analysis with
Spearman’s rank correlation coefficient and Mann-
Whitney test demonstrated the significant correlation of
reduction in S-OHIP(M) total score with deterioration of
perceived oral health status, the need for treatment, and
low satisfaction with oral health.
Association of RDITN-Endo score with Perceived Current
State of Oral Health
Increase in RDITN-Endo score was not
associated with deterioration of oral health or low
Figure 2: The flowchart of the study design satisfaction with oral health (Table 3). Alternatively,
25