Page 34 - MDJ 2022 Jan-Jun, Volume 45 Number 1
P. 34

Ahmad / Sebastian Rajah


                              Table 4: Length, density, and taper of the root canal fillings in relation to tooth group.
                       Tooth   Number           Length    ᵇ           D  e  n  s  i  t  y    ᵇ  T  a  per   ᵇ
                       group   of teeth   ᵃ  Acceptable   Under   Over   Acceptable   Poor   Acceptable   Poor
                                                          Maxilla
                                 88       46        39      3       43        45       48       40
                      Incisors
                               53.3 %    52.3 %   44.4 %   3.4 %   48.9 %   51.1 %   54.5 %   45.5 %
                                 1         0        1       0        0        1        0        1
                      Canines
                                0.6 %     0 %     100 %    0 %      0 %     100 %     0 %     100 %
                                 18        4        14      0        6        12       5        13
                     Premolars
                               10.9 %    22.2 %   77.8 %   0 %     33.3 %   66.7 %   27.8 %   72.2 %
                                 9         3        6       0        4        5        4        5
                      Molars
                                5.5 %    33.3 %   66.7 %   0 %     44.4 %   55.6 %   44.4 %   55.6 %
                                                         Mandible
                                 3         2        1       0        1        2        1        2
                      Incisors
                                1.8 %    66.7 %   33.3 %   0 %     33 %     66.7 %    33 %    66.7 %
                                 1         0        1       0        1        0        1        0
                      Canines
                                0.6 %     0 %     100 %    0 %     100 %     0 %     100 %     0 %
                                 13        4        9       0        5        8        6        7
                     Premolars
                                7.9 %    30.8 %   69.2 %   0 %     38.5 %   61.5 %   46.2 %   53.8 %
                                 32       13        19      0       12        20       13       19
                      Molars
                               19.4 %    40.6 %   59.4 %   0 %     37.5 %   62.5 %   40.6 %   59.4 %
                                 165      72        90      3       72        93       78       87
                       Total
                                100 %    43.6 %   54.5 %   1.8 %   43.6 %   56.4 %   47.3 %   52.7 %
                             ᵃ Percentage distribution within the total number of teeth
                             ᵇ Percentage distribution within each tooth group
                                                                Table 5: Quality of the root canal fillings in relation to tooth
                                                                                    group.

                                                                 Tooth     Number    Quality of root canal fillingᵇ
                                                                 group     of teethᵃ   Adequate    Inadequate
                                                                                   Maxilla
                                                                             88          23           65
                                                                Incisors
                                                                           53.3 %      69.7 %        49.2 %
                                                                              1          0             1
                                                                Canines
                                                                            0.6 %       0 %          0.8 %
                                                                             18          1            12
                                                               Premolars
                                                                           10.9 %       3.0 %        12.9 %
                                                                              9          3             6
                                                                 Molars
                                                                            5.5 %       9.1 %        4.5 %
                                                                                  Mandible
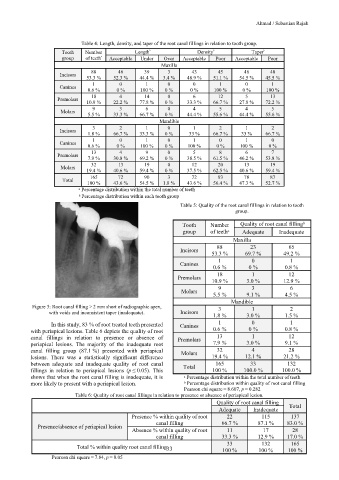
            Figure 3: Root canal filling > 2 mm short of radiographic apex,   3          1             2
                  with voids and inconsistent taper (inadequate).   Incisors
                                                                            1.8 %       3.0 %        1.5 %
                   In this study, 83 % of root treated teeth presented   Canines   1     0             1
            with periapical lesions. Table 6 depicts the quality of root    0.6 %       0 %          0.8 %
            canal  fillings  in  relation  to  presence  or  absence  of   Premolars   13   1         12
            periapical  lesions.  The  majority  of  the  inadequate  root   7.9 %      3.0 %        9.1 %
            canal  filling  group  (87.1 %)  presented  with  periapical   Molars   32   4            28
            lesions.  There  was  a  statistically  significant  difference   19.4 %   12.1 %        21.2 %
            between  adequate  and  inadequate  quality  of  root  canal   Total   165   33           132
            fillings  in  relation  to  periapical  lesions  (p ≤ 0.05).  This   100 %   100.0 %    100.0 %
            shows that when the root canal filling is inadequate, it is   ᵃ Percentage distribution within the total number of teeth
            more likely to present with a periapical lesion.      ᵇ Percentage distribution within quality of root canal filling
                                                                  Pearson chi square = 8.607, p = 0.282
                           Table 6: Quality of root canal fillings in relation to presence or absence of periapical lesion.
                                                                             Quality of root canal filling
                                                                                                       Total
                                                                              Adequate    Inadequate
                                               Presence % within quality of root   22        115       137
                                                        canal filling          66.7 %       87.1 %    83.0 %
              Presence/absence of periapical lesion
                                               Absence % within quality of root   11         17         28
                                                        canal filling          33.3 %       12.9 %    17.0 %
                                                                                 33          132       165
                            Total % within quality root canal filling  33      100 %        100 %     100 %
                   Pearson chi square = 7.84, p = 0.05
   29   30   31   32   33   34   35   36   37   38   39