
Page 43 - MDJ 2022 Jan-Jun, Volume 45 Number 1
P. 43
Antibacterial Effect of Ziziphus mauritiana on Streptococcus mutans
0.12 % CHX 20 % DMSO 0.12 % CHX 20 % DMSO 0.12 % CHX 20 % DMSO
200 mg/mℓ 500 mg/mℓ 200 mg/mℓ 500 mg/mℓ 200 mg/mℓ 500 mg/mℓ
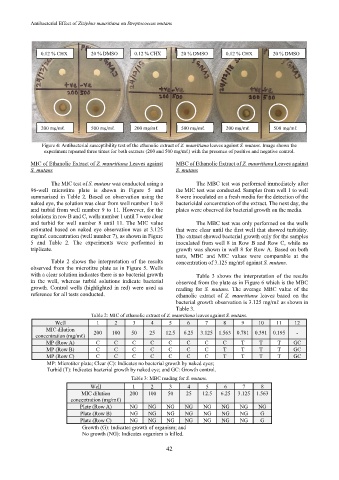
Figure 4: Antibacterial susceptibility test of the ethanolic extract of Z. mauritiana leaves against S. mutans. Image shows the
experiment repeated three times for both extracts (200 and 500 mg/mℓ) with the presence of positive and negative control.
MIC of Ethanolic Extract of Z. mauritiana Leaves against MBC of Ethanolic Extract of Z. mauritiana Leaves against
S. mutans S. mutans
The MIC test of S. mutans was conducted using a The MBC test was performed immediately after
96-well microtitre plate is shown in Figure 5 and the MIC test was conducted. Samples from well 1 to well
summarised in Table 2. Based on observation using the 8 were inoculated on a fresh media for the detection of the
naked eye, the solution was clear from well number 1 to 8 bactericidal concentration of the extract. The next day, the
and turbid from well number 9 to 11. However, for the plates were observed for bacterial growth on the media.
solutions in row B and C, wells number 1 until 7 were clear
and turbid for well number 8 until 11. The MIC value The MBC test was only performed on the wells
estimated based on naked eye observation was at 3.125 that were clear until the first well that showed turbidity.
mg/mℓ concentration (well number 7), as shown in Figure The extract showed bacterial growth only for the samples
5 and Table 2. The experiments were performed in inoculated from well 8 in Row B and Row C, while no
triplicate. growth was shown in well 8 for Row A. Based on both
tests, MBC and MIC values were comparable at the
Table 2 shows the interpretation of the results concentration of 3.125 mg/mℓ against S. mutans.
observed from the microtitre plate as in Figure 5. Wells
with a clear solution indicates there is no bacterial growth Table 3 shows the interpretation of the results
in the well, whereas turbid solutions indicate bacterial observed from the plate as in Figure 6 which is the MBC
growth. Control wells (highlighted in red) were used as reading for S. mutans. The average MBC value of the
reference for all tests conducted. ethanolic extract of Z. mauritiana leaves based on the
bacterial growth observation is 3.125 mg/mℓ as shown in
Table 3.
Table 2: MIC of ethanolic extract of Z. mauritiana leaves against S. mutans.
Well 1 2 3 4 5 6 7 8 9 10 11 12
MIC dilution 200 100 50 25 12.5 6.25 3.125 1.563 0.781 0.391 0.195 -
concentration (mg/mℓ)
MP (Row A) C C C C C C C C T T T GC
MP (Row B) C C C C C C C T T T T GC
MP (Row C) C C C C C C C T T T T GC
MP: Microtiter plate; Clear (C): Indicates no bacterial growth by naked eyes;
Turbid (T): Indicates bacterial growth by naked eye; and GC: Growth control.
Table 3: MBC reading for S. mutans.
Well 1 2 3 4 5 6 7 8
MIC dilution 200 100 50 25 12.5 6.25 3.125 1.563
concentration (mg/mℓ)
Plate (Row A) N G NG NG NG NG NG NG NG
Plate (Row B) N G NG NG NG NG NG NG G
Plate (Row C) N G NG NG NG NG NG NG G
Growth (G): Indicates growth of organism; and
No growth (NG): Indicates organism is killed.
42