
Page 29 - MDJ Volume 47 Number 2 ( Jul-Dec 2024)
P. 29
Fatima, et al.: Relationship of Cranial base growth with sagittal skeletal discrepancies
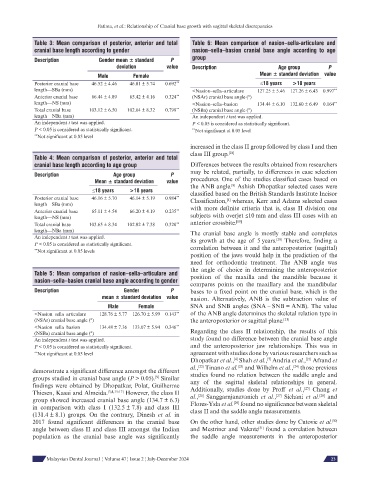
Table 3: Mean comparison of posterior, anterior and total Table 6: Mean comparison of nasion–sella-articulare and
cranial base length according to gender nasion–sella–basion cranial base angle according to age
group
Description Gender mean ± standard P
deviation value Description Age group P
Male Female Mean ± standard deviation value
Posterior cranial base 46.52 ± 4.46 46.01 ± 5.74 0.692 ** ≤18 years >18 years
length—SBa (mm) <Nasion–sella–articulare 127.25 ± 5.46 127.26 ± 6.43 0.997 **
Anterior cranial base 66.44 ± 4.89 65.42 ± 4.16 0.324 ** (NSAr) cranial base angle (°)
length—NS (mm) <Nasion–sella–basion 134.44 ± 6.10 132.60 ± 6.49 0.164 **
Total cranial base 103.12 ± 6.50 102.64 ± 8.32 0.798 ** (NSBa) cranial base angle (°)
length—NBa (mm) An independent t test was applied.
An independent t test was applied. P < 0.05 is considered as statistically significant.
P < 0.05 is considered as statistically significant. ** Not significant at 0.05 level
** Not significant at 0.05 level
increased in the class II group followed by class I and then
class III group. [18]
Table 4: Mean comparison of posterior, anterior and total
cranial base length according to age group Differences between the results obtained from researchers
may be related, partially, to differences in case selection
Description Age group P
Mean ± standard deviation value procedures. One of the studies classified cases based on
[9]
the ANB angle. Ashish Dhopatkar selected cases were
≤18 years >18 years classified based on the British Standards Institute Incisor
Posterior cranial base 46.16 ± 5.70 46.14 ± 5.19 0.984 ** Classification, whereas, Kerr and Adams selected cases
[4]
length—SBa (mm) with more definite criteria that is, class II division one
Anterior cranial base 65.11 ± 4.54 66.20 ± 4.19 0.235 **
length—NS (mm) subjects with overjet ≤10 mm and class III cases with an
[19]
Total cranial base 103.65 ± 8.34 102.02 ± 7.38 0.320 ** anterior crossbite.
length—NBa (mm) The cranial base angle is mostly stable and completes
An independent t test was applied. its growth at the age of 5 years. Therefore, finding a
[20]
P < 0.05 is considered as statistically significant. correlation between it and the anteroposterior (sagittal)
** Not significant at 0.05 levels
position of the jaws would help in the prediction of the
need for orthodontic treatment. The ANB angle was
the angle of choice in determining the anteroposterior
Table 5: Mean comparison of nasion–sella–articulare and position of the maxilla and the mandible because it
nasion–sella–basion cranial base angle according to gender
compares points on the maxillary and the mandibular
Description Gender P bases to a fixed point on the cranial base, which is the
mean ± standard deviation value nasion. Alternatively, ANB is the subtraction value of
Male Female SNA and SNB angles (SNA – SNB = ANB). The value
<Nasion–sella–articulare 128.76 ± 5.77 126.70 ± 5.99 0.143 ** of the ANB angle determines the skeletal relation type in
(NSAr) cranial base angle (°) the anteroposterior or sagittal plane. [21]
<Nasion–sella–basion 134.48 ± 7.36 133.07 ± 5.94 0.346 **
(NSBa) cranial base angle (°) Regarding the class II relationship, the results of this
An independent t test was applied. study found no difference between the cranial base angle
P < 0.05 is considered as statistically significant. and the anteroposterior jaw relationships. This was in
** Not significant at 0.05 level agreement with studies done by various researchers such as
[21]
[7]
Dhopatkar et al., Shah et al., Andria et al., Afrand et
[4]
al., Tinano et al. and Wilhelm et al., those previous
[22]
[23]
[24]
demonstrate a significant difference amongst the different
groups studied in cranial base angle (P > 0.05). Similar studies found no relation between the saddle angle and
[9]
findings were obtained by Dhopatkar, Polat, Guilherme any of the sagittal skeletal relationships in general.
[25]
Thiesen, Kasai and Almeida. [3,4,15-17] However, the class II Additionally, studies done by Proff et al., Chang et
[28]
[27]
[26]
group showed increased cranial base angle (134.7 ± 6.3) al., Sanggarnjanavanich et al., Sichani et al. and
[29]
in comparison with class I (132.5 ± 7.8) and class III Flores-Ysla et al. found no significance between skeletal
(131.4 ± 8.1) groups. On the contrary, Dinesh et al. in class II and the saddle angle measurements.
2017 found significant differences in the cranial base On the other hand, other studies done by Cutovic et al.
[30]
angle between class II and class III amongst the Indian and Mestriner and Valente found a correlation between
[31]
population as the cranial base angle was significantly the saddle angle measurements in the anteroposterior
Malaysian Dental Journal ¦ Volume 47 ¦ Issue 2 ¦ July-December 2024 23